Money Forest Strategy

Money Forest is a systematic trend-following quant strategy designed to outperform the traditional buy-and-hold approach by maximizing trend profits while minimizing drawdowns. As a mid-term strategy, it maintains an average holding period of 30 to 45 days.
To optimize entries, the strategy monitors multiple timeframes - 4H, 8H, 12H, and 24H. allowing for a more dynamic and adaptive approach to market trends.
It performs best on tokens with multiple years of historical data, ensuring reliable trend identification and execution.
Money Forest ⇑ 1 - Strategy Breakdown
- 32% BTC
- 32% ETH
- 32% SOL
- 4% Reserve
You can deposit into Hyperliquid vault to earn a share of the P&L here.
Money Forest ⇑ 1
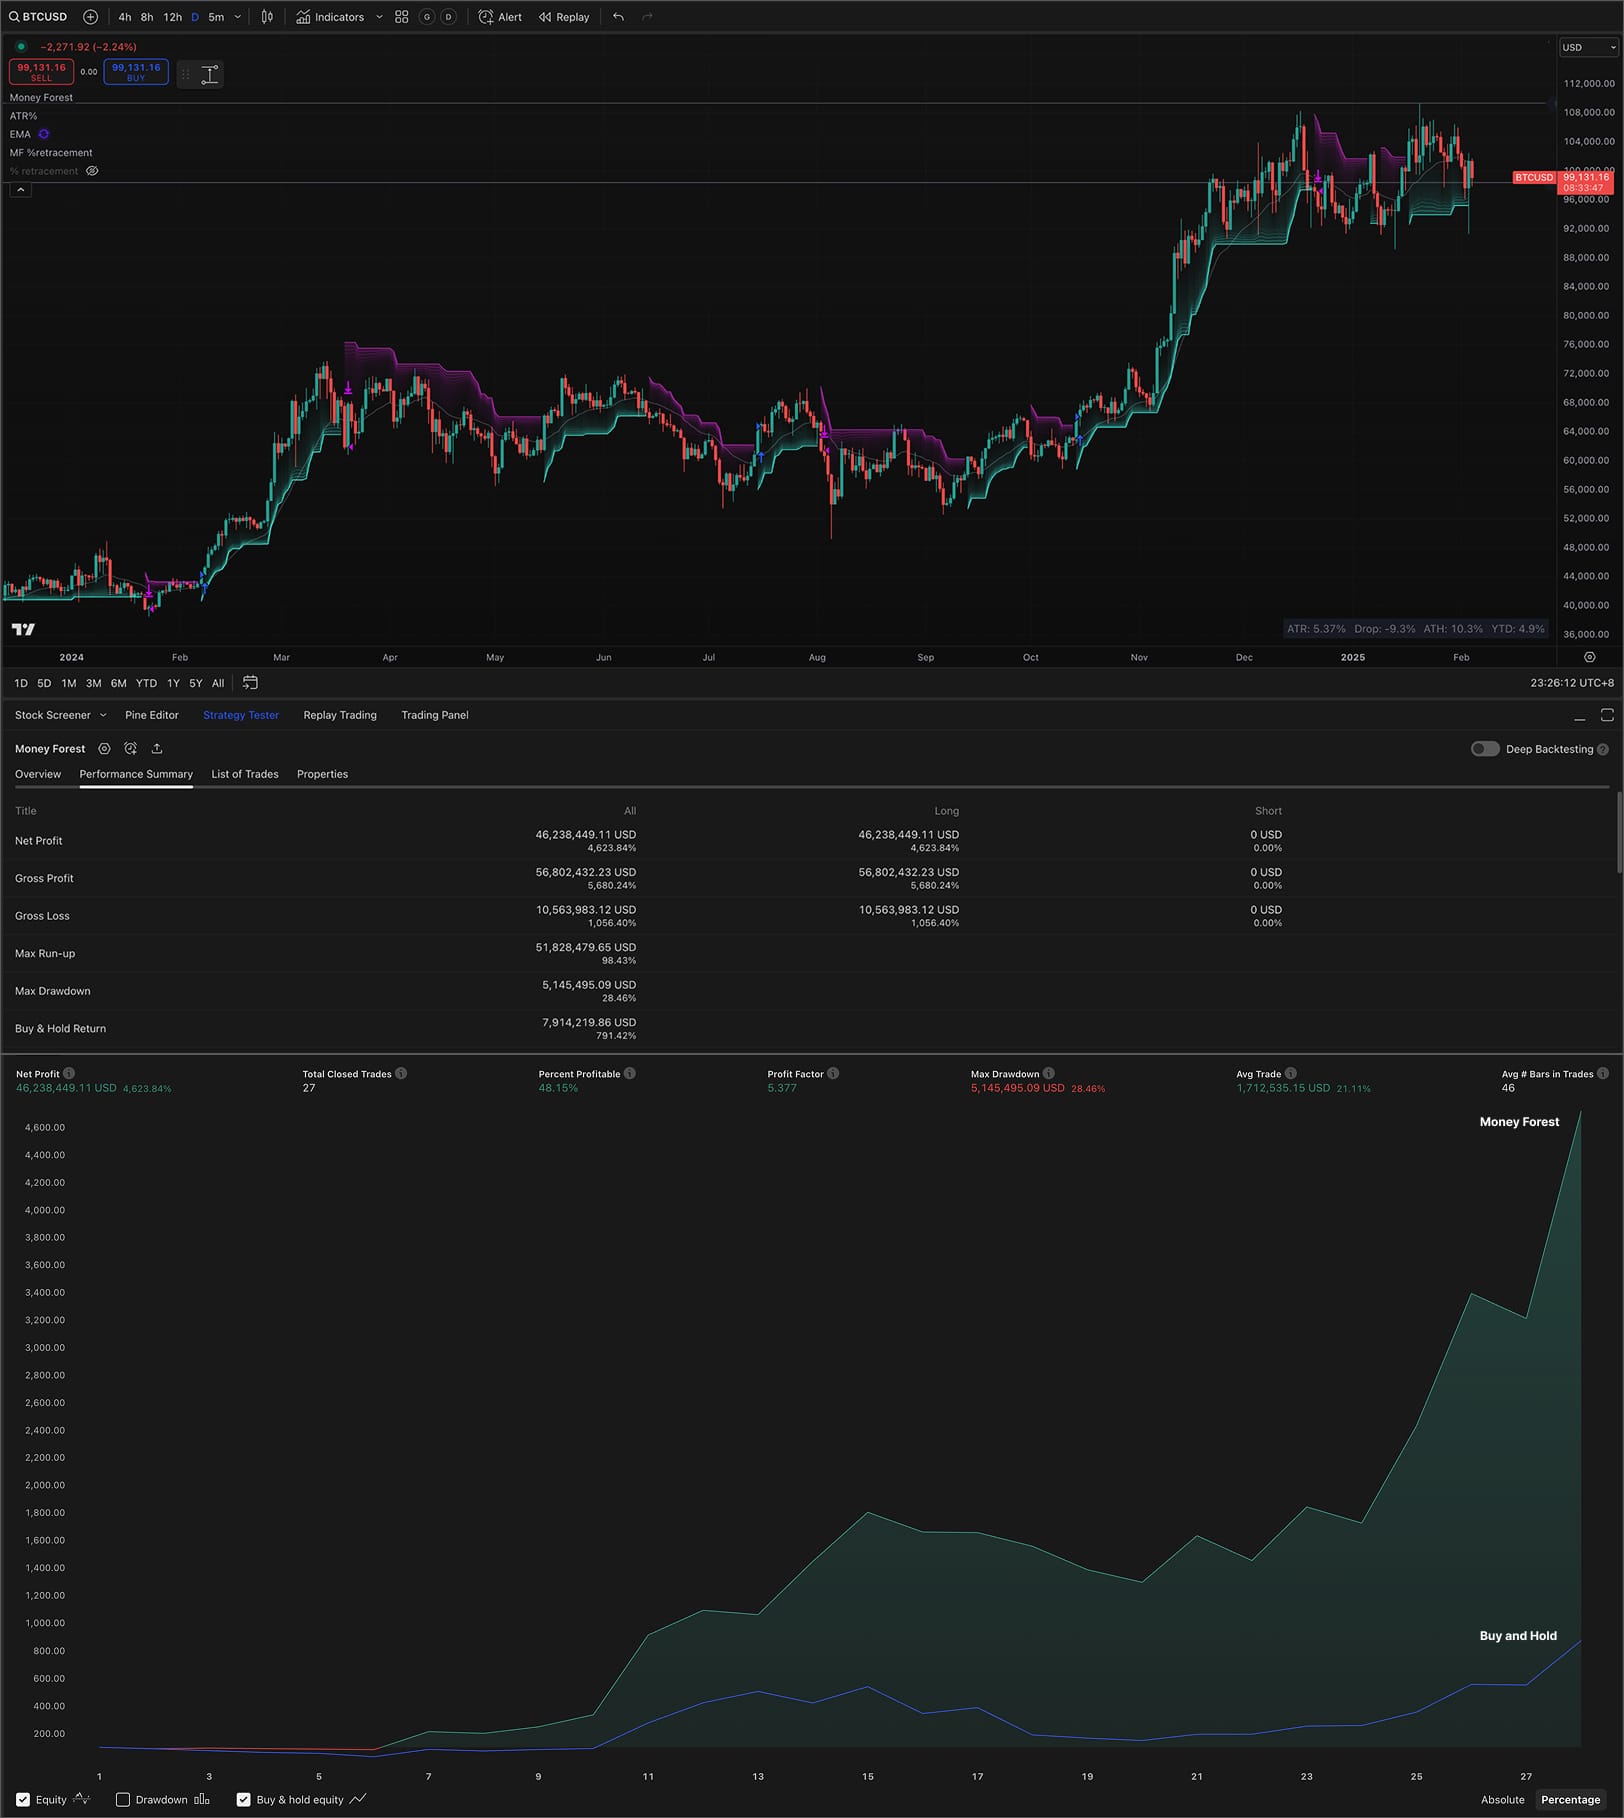
BTC Backtest Results
Token: BTC
Backtest Period: 2018 to 2024 (7 Years)
Buy & Hold
Net Profit: 791.42%
Money Forest Strategy (Daily)
Net Profit: 4523.84%
Max Drawdown: 28.46%
Total Closed Trades: 27
Win Rate: 48.15%
Money Forest Strategy (12H)
Net Profit: 6529.23%
Max Drawdown: 37.18%
Total Closed Trades: 28
Win Rate: 50%
Money Forest Strategy (8H)
Net Profit: 6932.71%
Max Drawdown: 26.41%
Total Closed Trades: 29
Win Rate: 48.28%
Money Forest Strategy (4H)
Net Profit: 4978.71%
Max Drawdown: 28.17%
Total Closed Trades: 150
Win Rate: 50%
The goal is to allocate 25% of capital allocated to the token to each timeframe, ensuring diversified entries that enhance returns while effectively managing drawdowns over the long term.
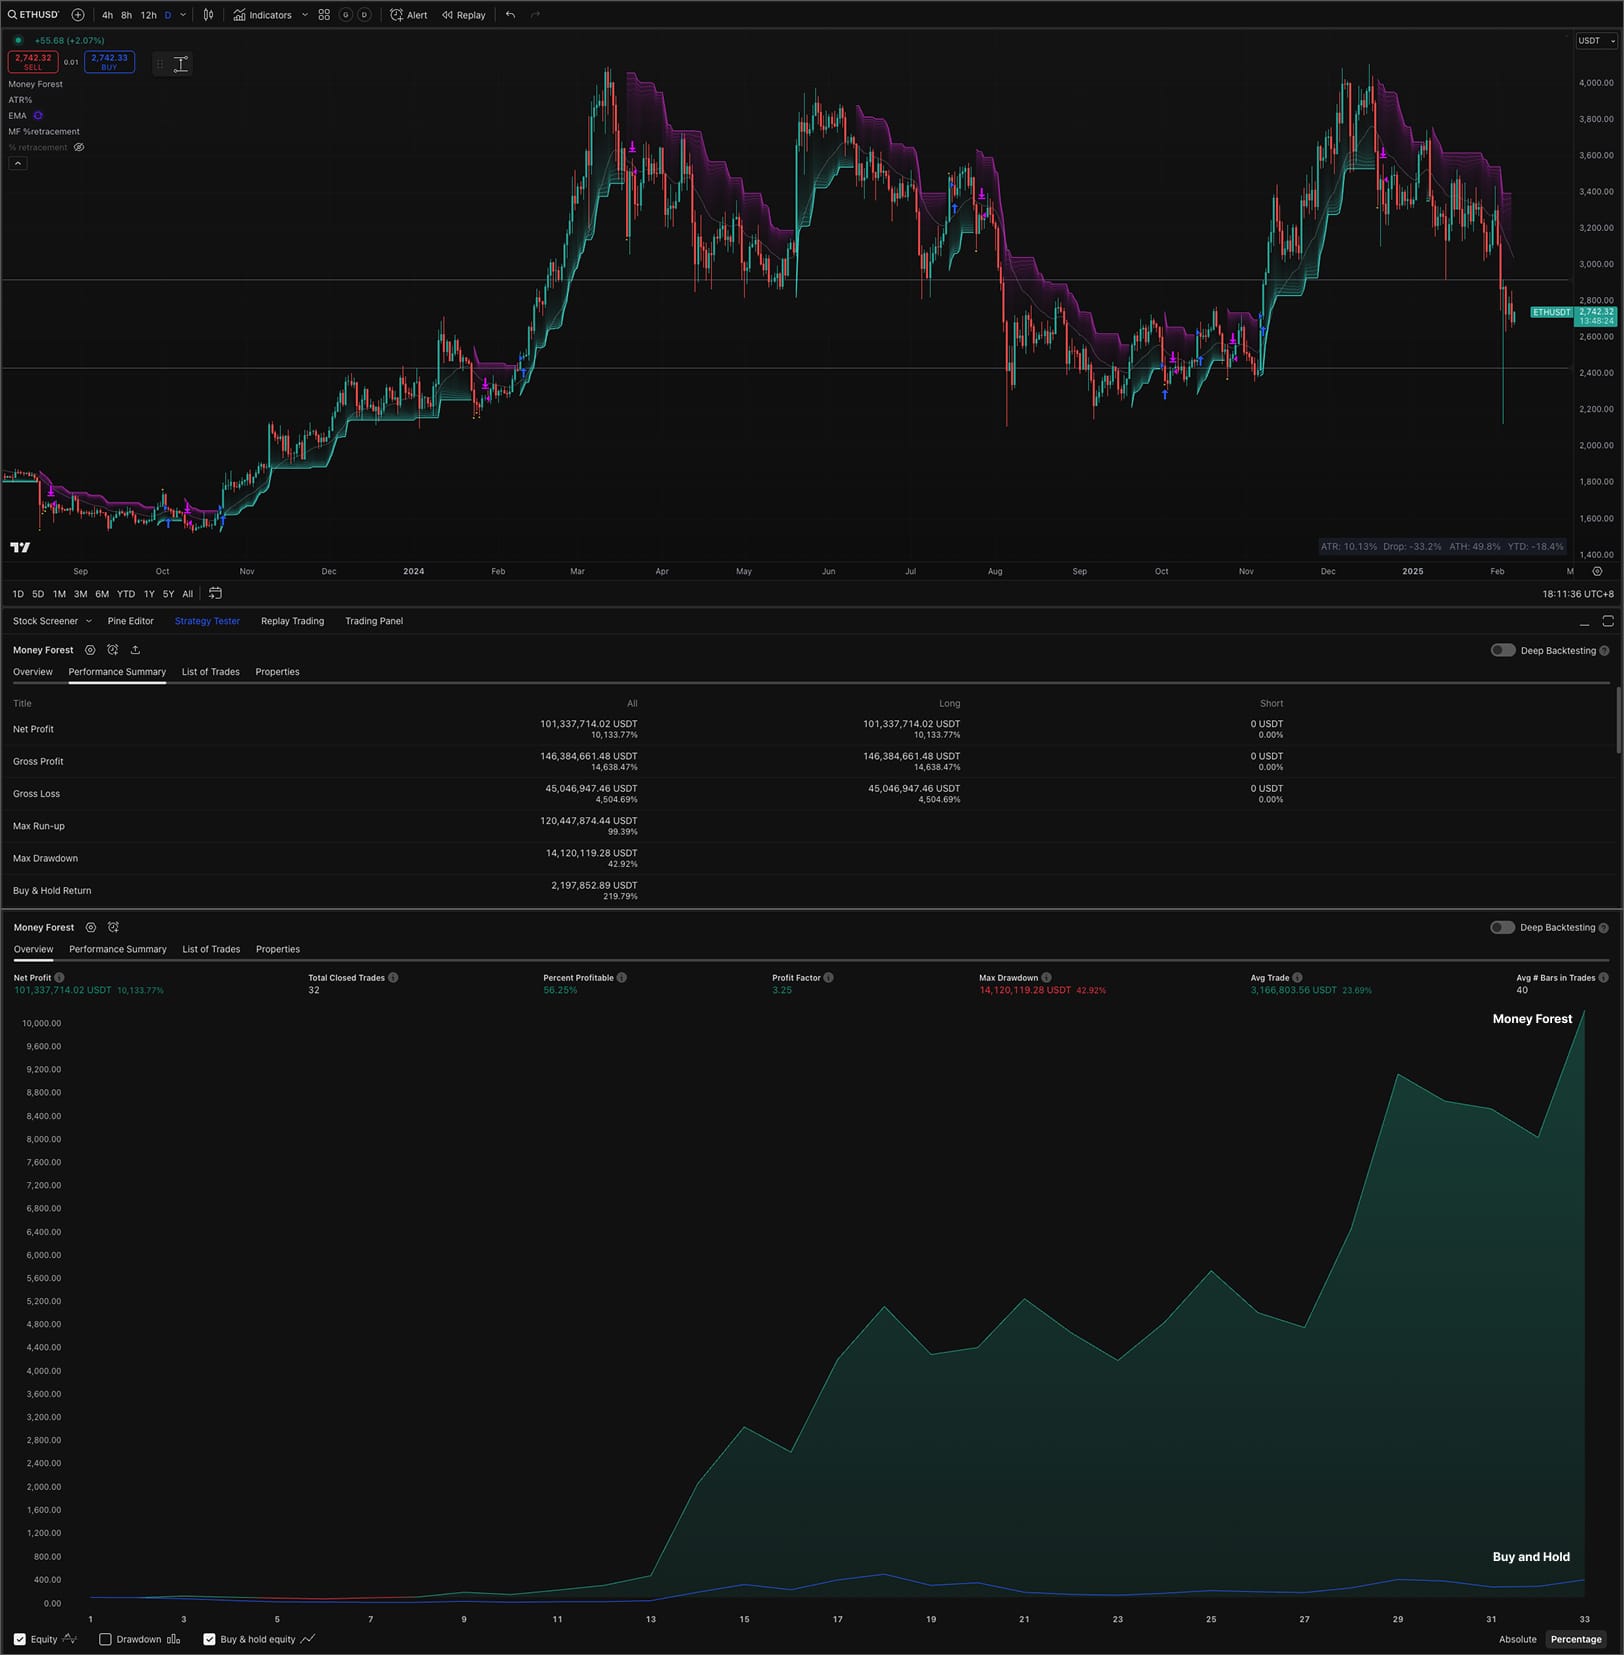
ETH Backtest Results
Token: ETH
Backtest Period: 2018 to 2024 (7 Years)
Buy & Hold
Net Profit: 219.79%
Money Forest Strategy (Daily)
Net Profit: 10133.77%
Max Drawdown: 42.92%
Total Closed Trades: 27
Win Rate: 56.25%
Money Forest Strategy (12H)
Net Profit: 5303.59%
Max Drawdown: 32.60%
Total Closed Trades: 27
Win Rate: 62.96%
Money Forest Strategy (8H)
Net Profit: 10722.12%
Max Drawdown: 32.57%
Total Closed Trades: 28
Win Rate: 60.71%
Money Forest Strategy (4H)
Net Profit: 11512.73%
Max Drawdown: 34.19%
Total Closed Trades: 49
Win Rate: 46.94%
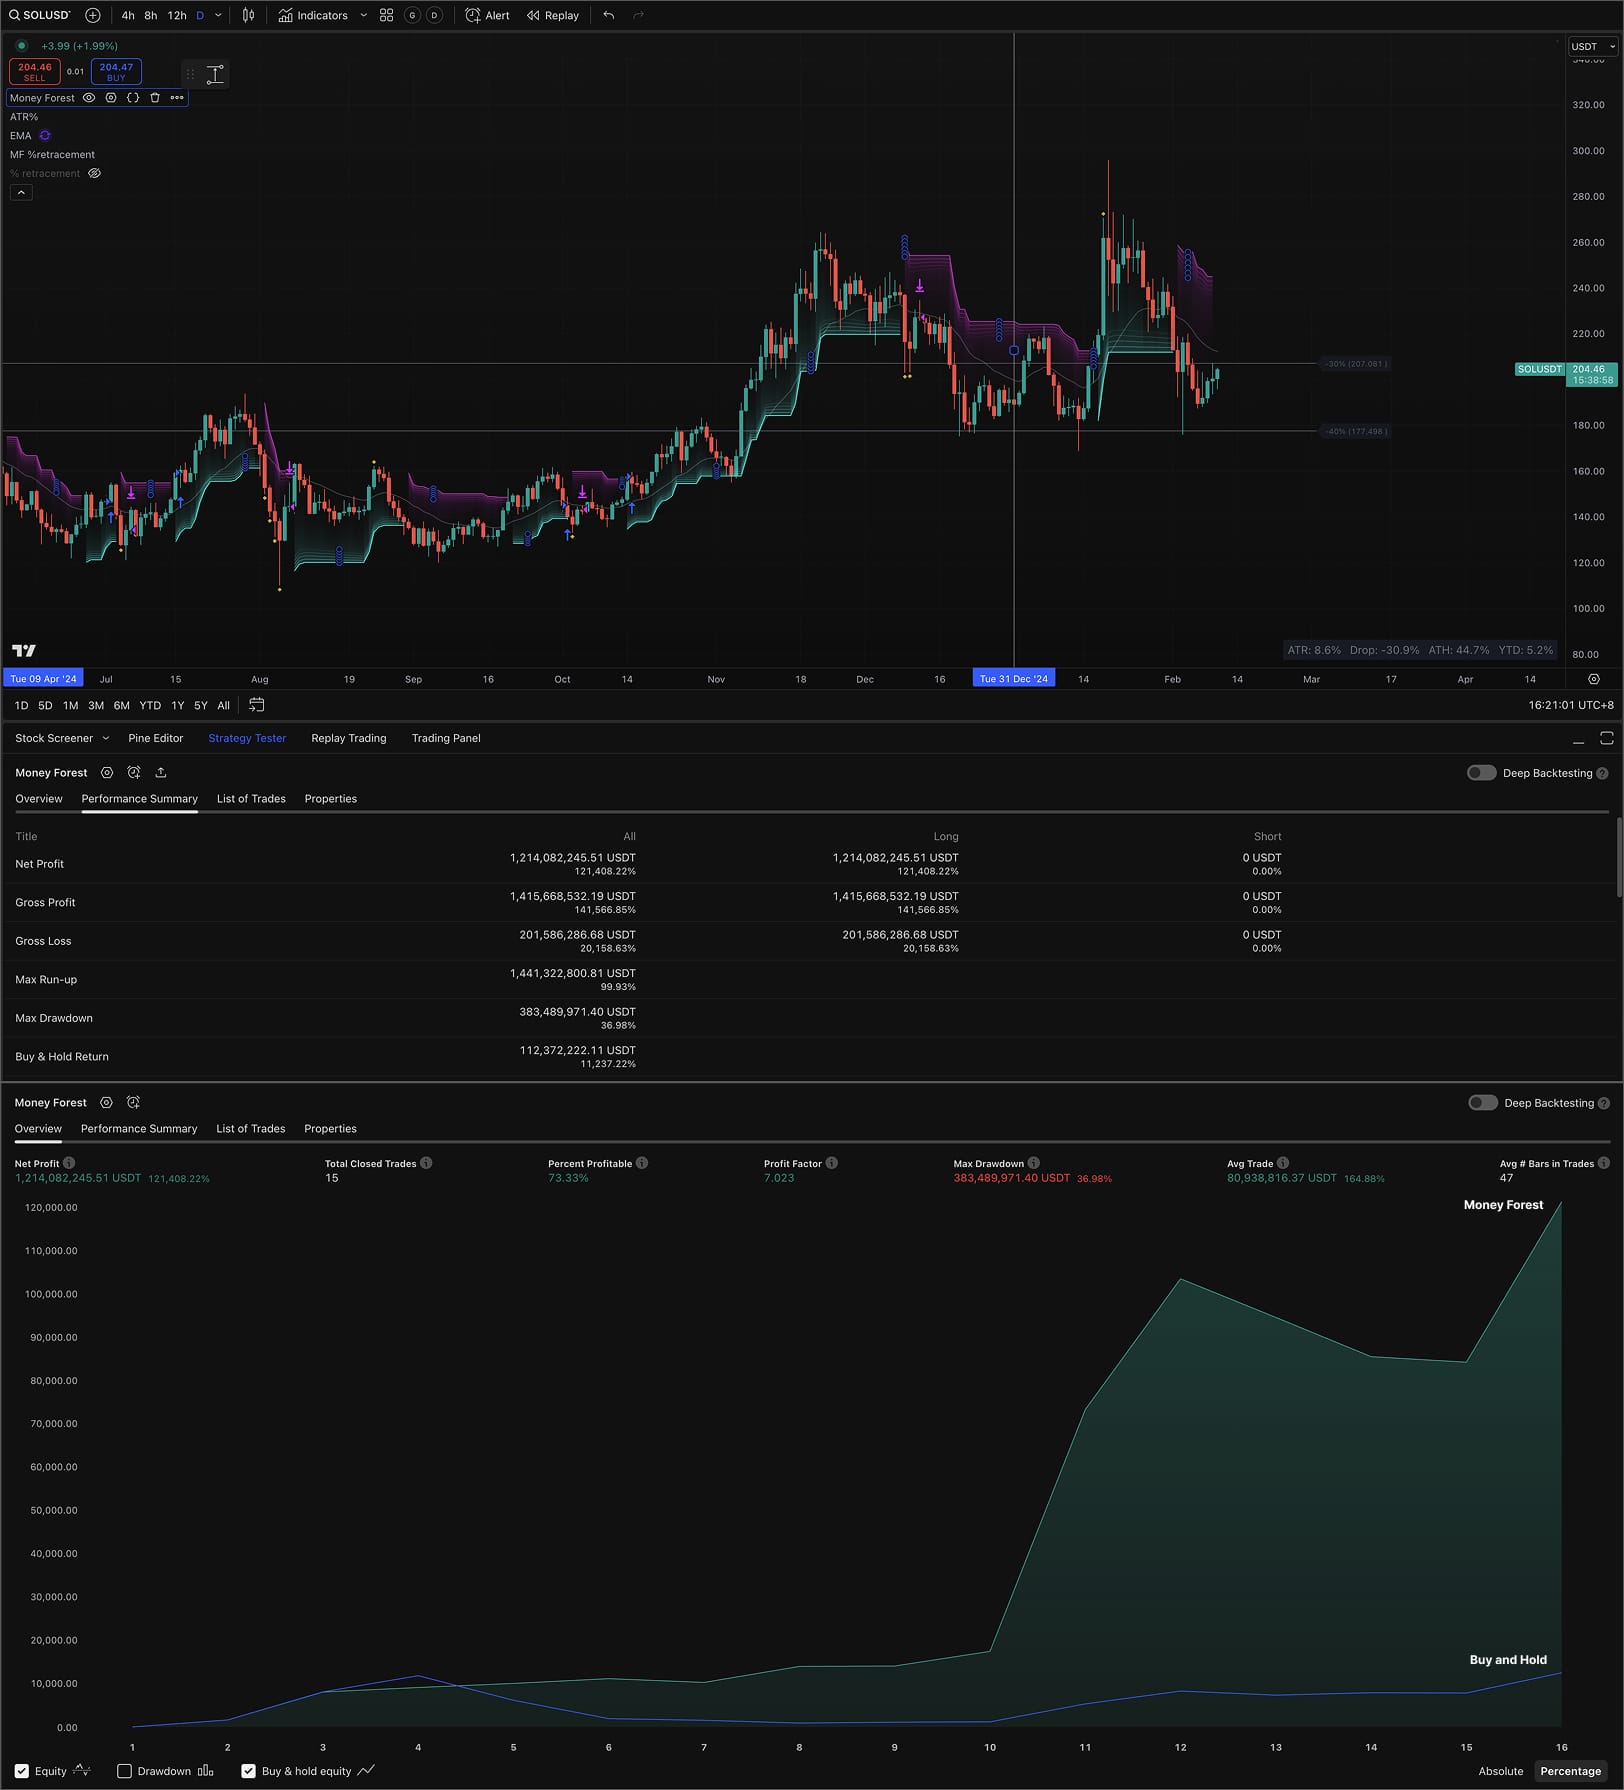
SOL Backtest Results
Token: SOL
Backtest Period: 2021 to 2024 (4 Years)
Buy & Hold
Net Profit: 10887.22%
Money Forest Strategy (Daily)
Net Profit: 121408.22%
Max Drawdown: 40.02%
Total Closed Trades: 15
Win Rate: 66.67%
Money Forest Strategy (12H)
Net Profit: 82866.25%
Max Drawdown: 49.43%
Total Closed Trades: 29
Win Rate: 58.62%
Money Forest Strategy (8H)
Net Profit: 117223.09%
Max Drawdown: 32.55%
Total Closed Trades: 14
Win Rate: 64.29%
Money Forest Strategy (4H)
Net Profit: 125028.43%
Max Drawdown: 47.56%
Total Closed Trades: 30
Win Rate: 60.00%
FAQ
If a specific timeframe performs the best, why not focus solely on that timeframe instead of diversifying trades across multiple timeframes?
Diversifying entries across different timeframes helps reduce drawdowns while maximizing returns. While the strategy may perform exceptionally well on a particular timeframe, there is no guarantee it will continue to deliver the same results in future trades. Market conditions can change, and diversification provides a buffer against unexpected volatility, ensuring more consistent performance over time.